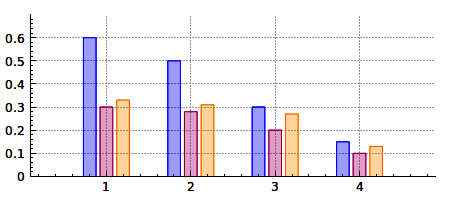
Groups multiple QCPBars together so they appear side by side. More...
Inherits QObject.
Public Types | |
| enum | SpacingType |
Public Functions | |
| QCPBarsGroup (QCustomPlot *parentPlot) | |
| SpacingType | spacingType () const |
| double | spacing () const |
| void | setSpacingType (SpacingType spacingType) |
| void | setSpacing (double spacing) |
| QList< QCPBars * > | bars () const |
| QCPBars * | bars (int index) const |
| int | size () const |
| bool | isEmpty () const |
| void | clear () |
| bool | contains (QCPBars *bars) const |
| void | append (QCPBars *bars) |
| void | insert (int i, QCPBars *bars) |
| void | remove (QCPBars *bars) |
Protected Functions | |
| void | registerBars (QCPBars *bars) |
| void | unregisterBars (QCPBars *bars) |
| double | keyPixelOffset (const QCPBars *bars, double keyCoord) |
| double | getPixelSpacing (const QCPBars *bars, double keyCoord) |
Detailed Description
Groups multiple QCPBars together so they appear side by side.

When showing multiple QCPBars in one plot which have bars at identical keys, it may be desirable to have them appearing next to each other at each key. This is what adding the respective QCPBars plottables to a QCPBarsGroup achieves. (An alternative approach is to stack them on top of each other, see QCPBars::moveAbove.)
Usage
To add a QCPBars plottable to the group, create a new group and then add the respective bars intances:
Alternatively to appending to the group like shown above, you can also set the group on the QCPBars plottable via QCPBars::setBarsGroup.
The spacing between the bars can be configured via setSpacingType and setSpacing. The bars in this group appear in the plot in the order they were appended. To insert a bars plottable at a certain index position, or to reposition a bars plottable which is already in the group, use insert.
To remove specific bars from the group, use either remove or call QCPBars::setBarsGroup(0) on the respective bars plottable.
To clear the entire group, call clear, or simply delete the group.
Example
The image above is generated with the following code:
Member Enumeration Documentation
Defines the ways the spacing between bars in the group can be specified. Thus it defines what the number passed to setSpacing actually means.
- See Also
- setSpacingType, setSpacing
Constructor & Destructor Documentation
| QCPBarsGroup::QCPBarsGroup | ( | QCustomPlot * | parentPlot | ) |
Constructs a new bars group for the specified QCustomPlot instance.
Member Function Documentation
| void QCPBarsGroup::setSpacingType | ( | SpacingType | spacingType | ) |
Sets how the spacing between adjacent bars is interpreted. See SpacingType.
The actual spacing can then be specified with setSpacing.
- See Also
- setSpacing
| void QCPBarsGroup::setSpacing | ( | double | spacing | ) |
Sets the spacing between adjacent bars. What the number passed as spacing actually means, is defined by the current SpacingType, which can be set with setSpacingType.
- See Also
- setSpacingType
|
inline |
Returns all bars currently in this group.
- See Also
- bars(int index)
| QCPBars * QCPBarsGroup::bars | ( | int | index | ) | const |
|
inline |
Returns the number of QCPBars plottables that are part of this group.
|
inline |
Returns whether this bars group is empty.
- See Also
- size
|
inline |
Returns whether the specified bars plottable is part of this group.
| void QCPBarsGroup::append | ( | QCPBars * | bars | ) |
Adds the specified bars plottable to this group. Alternatively, you can also use QCPBars::setBarsGroup on the bars instance.
| void QCPBarsGroup::insert | ( | int | i, |
| QCPBars * | bars | ||
| ) |
| void QCPBarsGroup::remove | ( | QCPBars * | bars | ) |
|
protected |
Adds the specified bars to the internal mBars list of bars. This method does not change the barsGroup property on bars.
- See Also
- unregisterBars
|
protected |
Removes the specified bars from the internal mBars list of bars. This method does not change the barsGroup property on bars.
- See Also
- registerBars
|
protected |
Returns the pixel offset in the key dimension the specified bars plottable should have at the given key coordinate keyCoord. The offset is relative to the pixel position of the key coordinate keyCoord.
|
protected |
Returns the spacing in pixels which is between this bars and the following one, both at the key coordinate keyCoord.
- Note
- Typically the returned value doesn't depend on bars or keyCoord. bars is only needed to get acces to the key axis transformation and axis rect for the modes stAxisRectRatio and stPlotCoords. The keyCoord is only relevant for spacings given in stPlotCoords on a logarithmic axis.
The documentation for this class was generated from the following files:
- src/plottables/plottable-bars.h
- src/plottables/plottable-bars.cpp